Skip to content
Contact

Software for Every Station

Live3 collects the readings from your weather stations and data loggers, from Aeron or any other maker, and turns them into live dashboards, alerts, reports and an API. Use it in the browser, in the Live3 Mobile app, or on site through DALI, the station's own console.
Live3 platform
  • 3Ways to use itWeb, mobile app and station console
  • 26Calculated valuesWorked out from every reading
  • Any makerHardwareAeron loggers, other brands and CSV files
  • REST APIYour dataStandard JSON output

What Live3 does

Four things Live3 does for every station you connect.

  • Real-Time Collection

    Readings arrive from Aeron loggers and other devices as they are sent. Sites without a connection can upload CSV files.

  • Same Names Everywhere

    Give each parameter one name, unit and set of limits, and every station uses them, whichever brand of sensor it has.

  • Values Worked Out for You

    Performance ratio, CUF, energy and rainfall totals and more are calculated from every reading, with no scripts to write.

  • Secure Access

    Single sign-on, roles that decide who sees which page, an audit log of changes, and data kept in its own region.

How your data flows

Six stages from a sensor reading to your screen. Dashboards, alerts, reports and the API all read the same stored data.

  1. 1

    Field devices

    Aeron loggers, other brands of logger, or CSV files

  2. 2

    Ingest

    Readings arrive as they are sent, and duplicates are ignored

  3. 3

    Normalise

    Each sensor gets one name, unit and set of limits

  4. 4

    Calculate

    26 values, including PR, CUF, energy and rainfall, are calculated from every reading

  5. 5

    Store

    Everything is kept in one store, in your region

  6. 6

    Serve

    Dashboards, alerts, reports and the API all read the same data

Three views. One platform.

From the whole fleet on a map to one sensor over a year, each view answers an operator's question without an export.

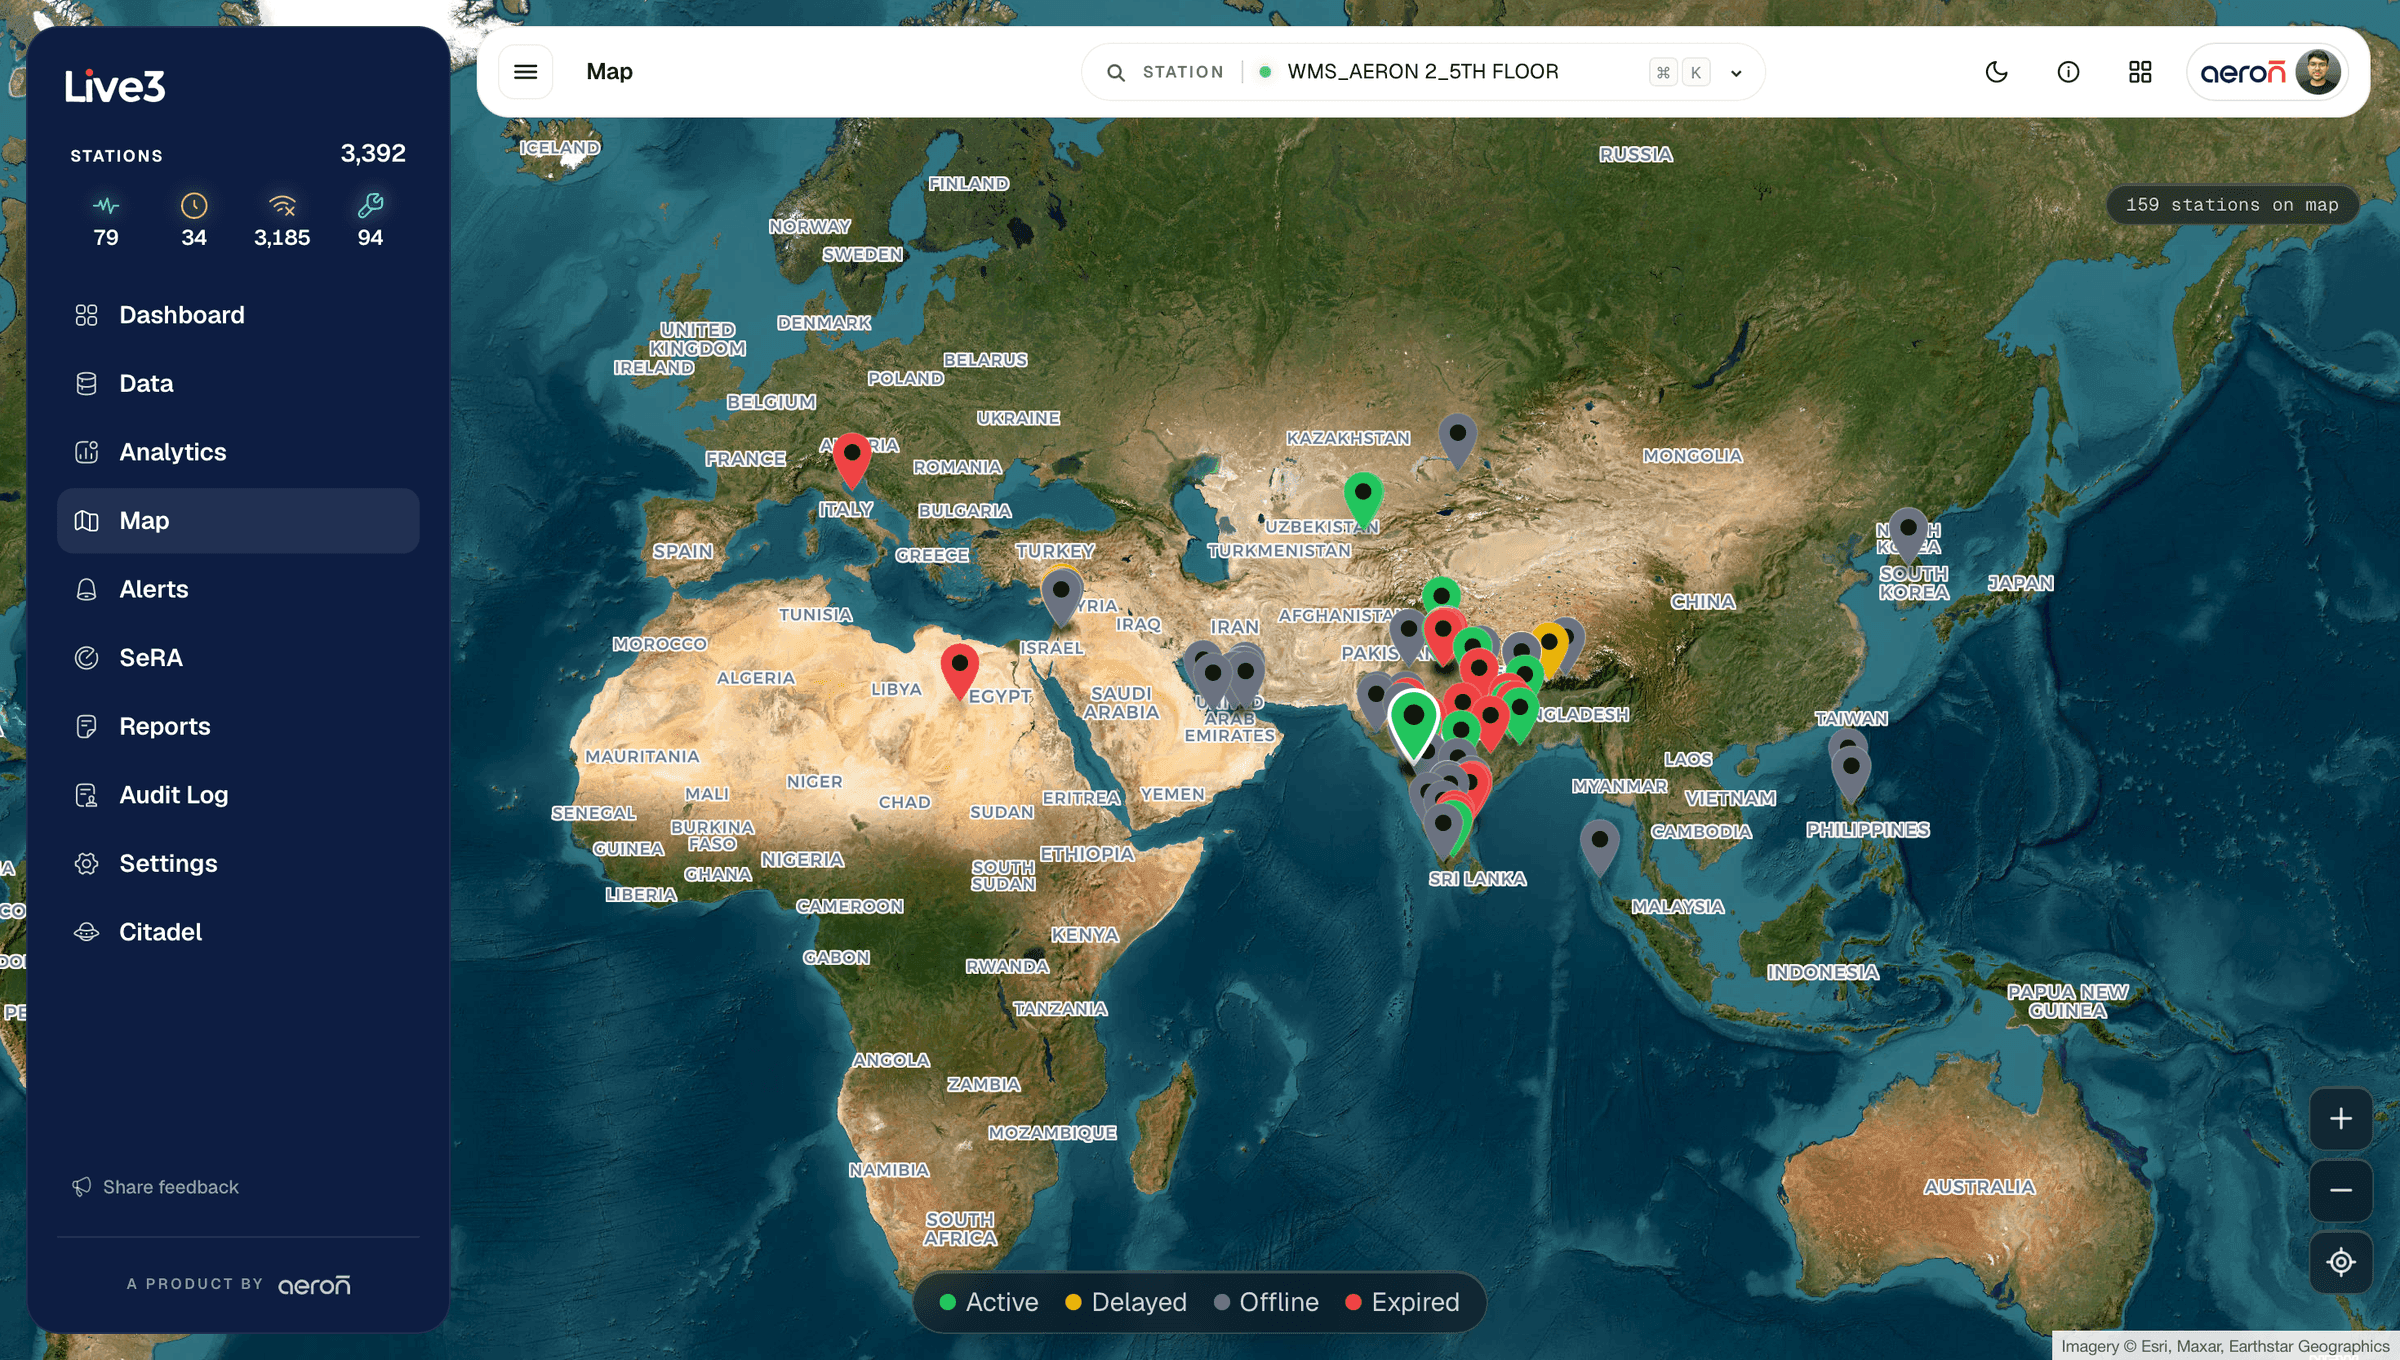
Live Fleet Map

Live Fleet Map

Every station on a satellite map, coloured by its state, with the time it last reported. An offline or unhealthy station stands out at once.

Full product

Web, mobile and on the station

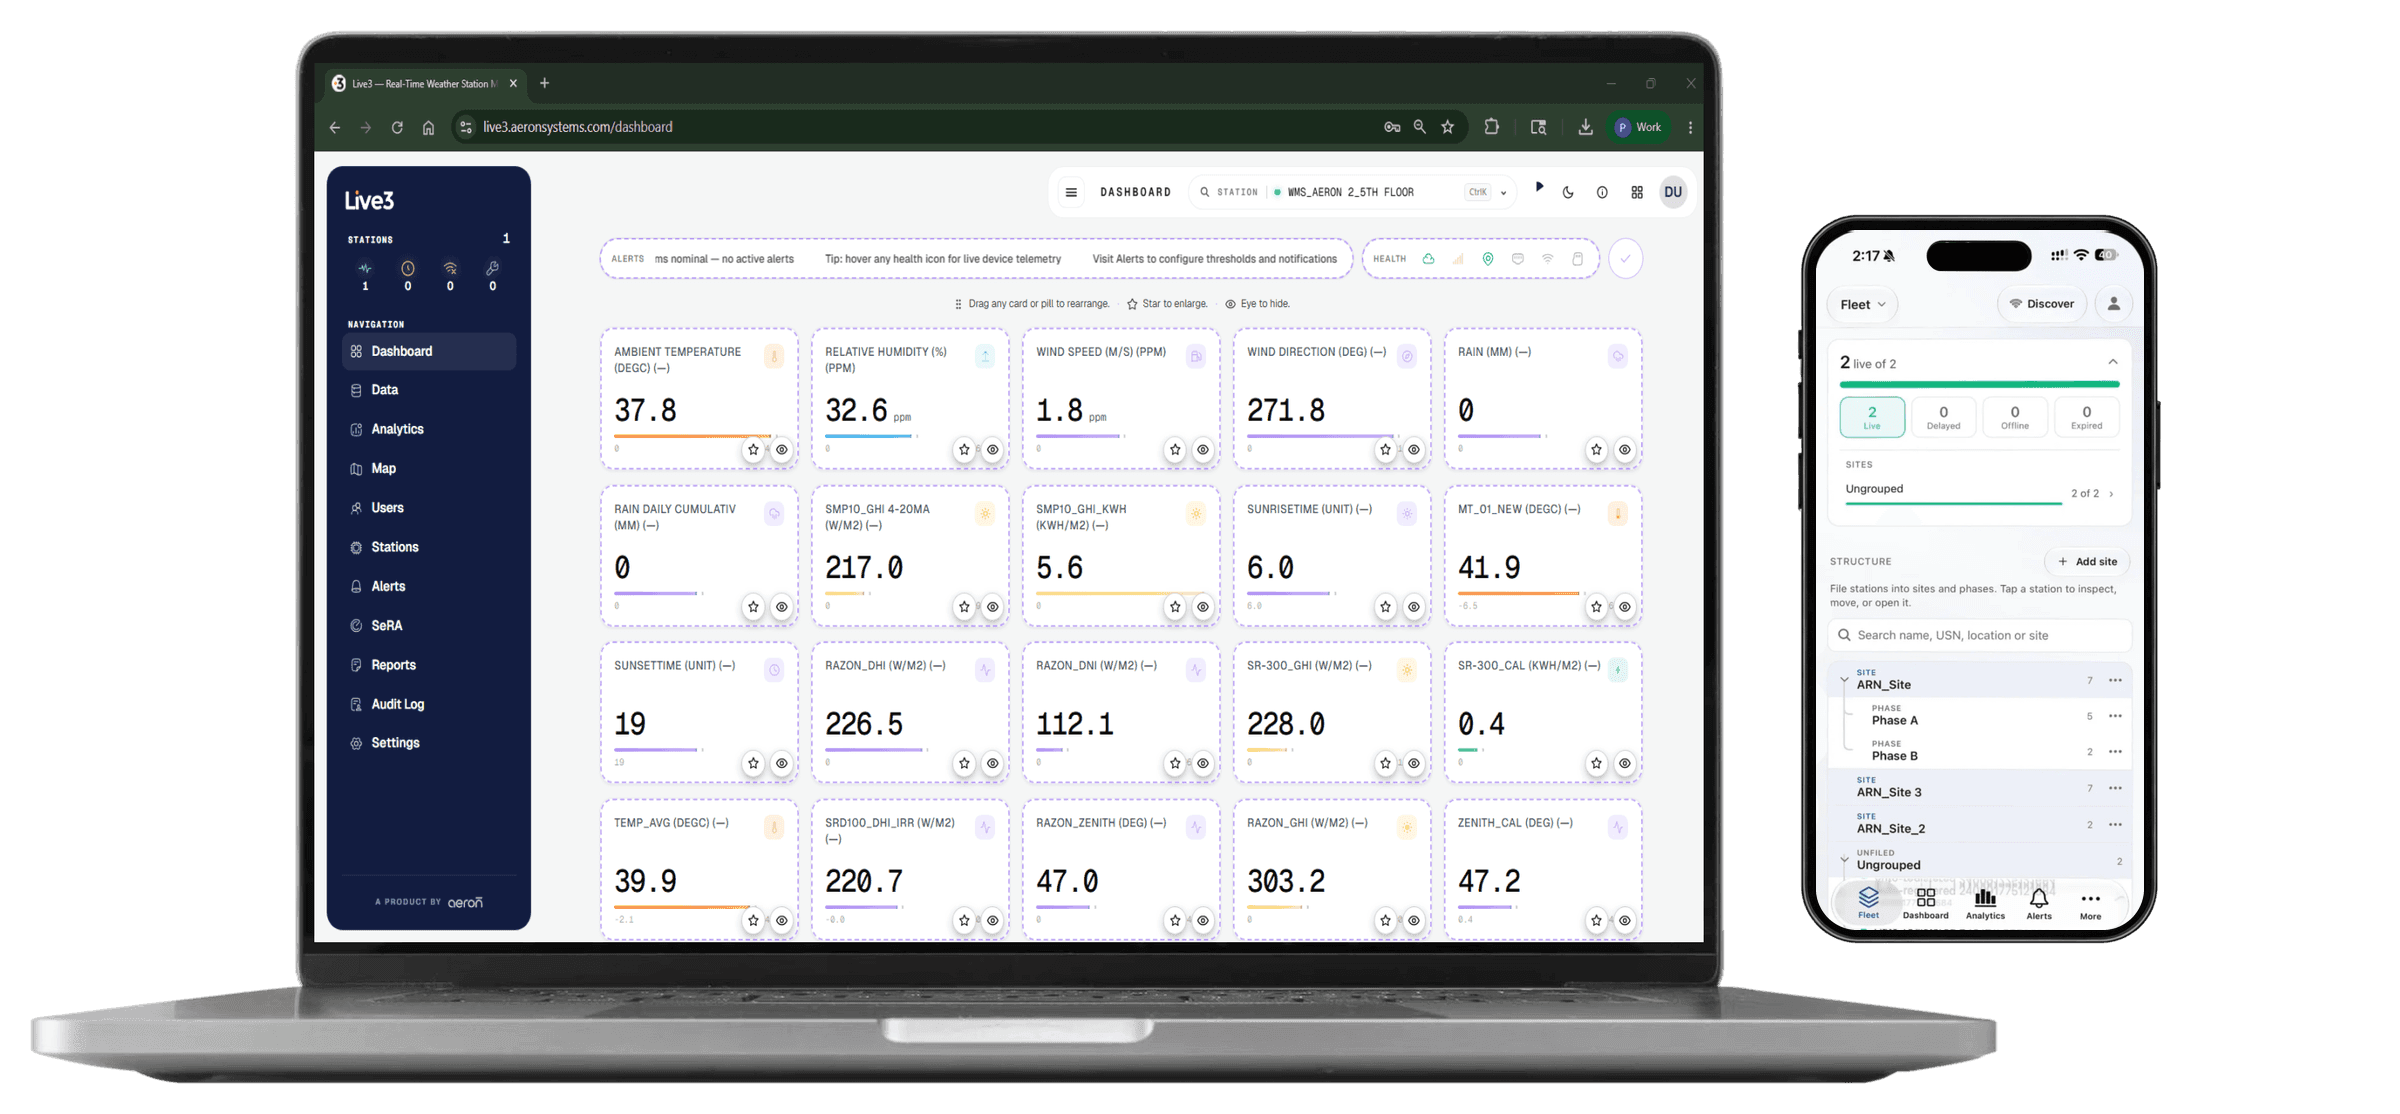
One platform, three ways in: Live3 in the browser, the Live3 Mobile app, and the DALI console on the station itself.

Live3
Available now

Monitoring platform: web, mobile and station console

Live3 turns the readings from every station, whichever brand, into one live view: a fleet map, dashboards, alerts that do not cry wolf, scheduled PDF reports, remote access to the station and an API. Live3 Mobile puts the readings and alerts on your phone, and DALI lets an engineer set up and check a station on site, in step with Live3.

  • 26Calculated values
  • WebBrowser
  • MobileiOS and Android app
  • DALIStation console

Key Capabilities

  • Fleet map showing each station's state
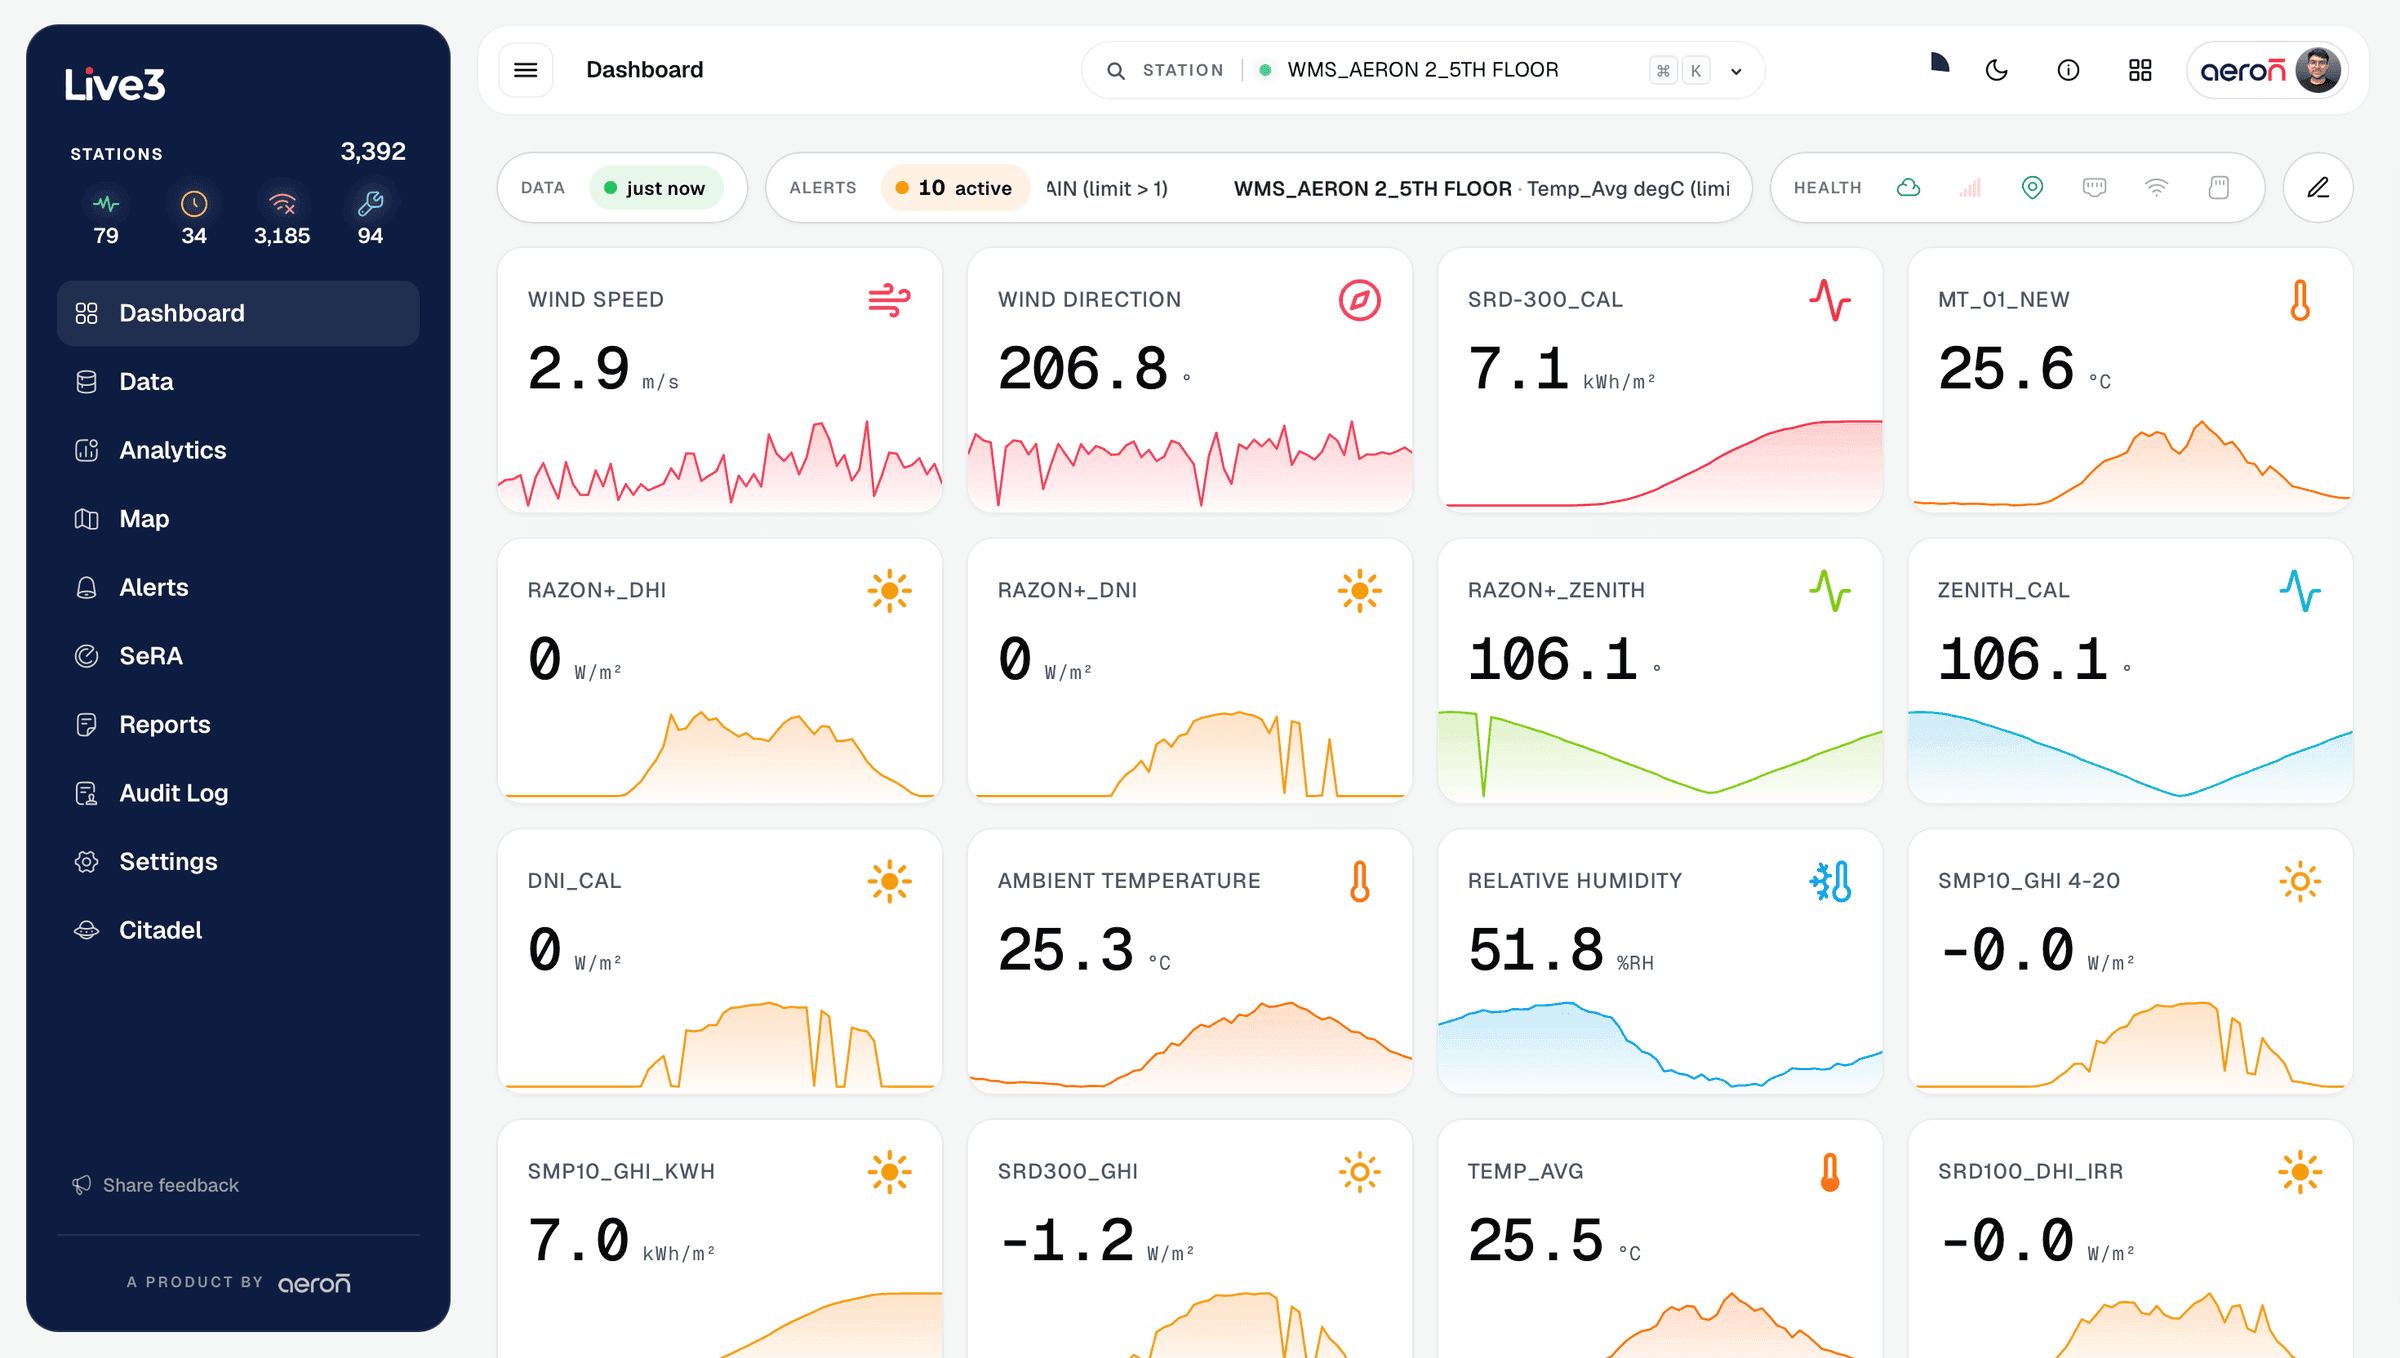
  • Live dashboard with the day's highs and lows
  • One name and unit per parameter, any sensor brand
  • 26 calculated values, including PR and CUF
  • Alerts for out-of-range readings and silent stations
  • Remote access to the station from your browser
  • Scheduled PDF reports with your branding
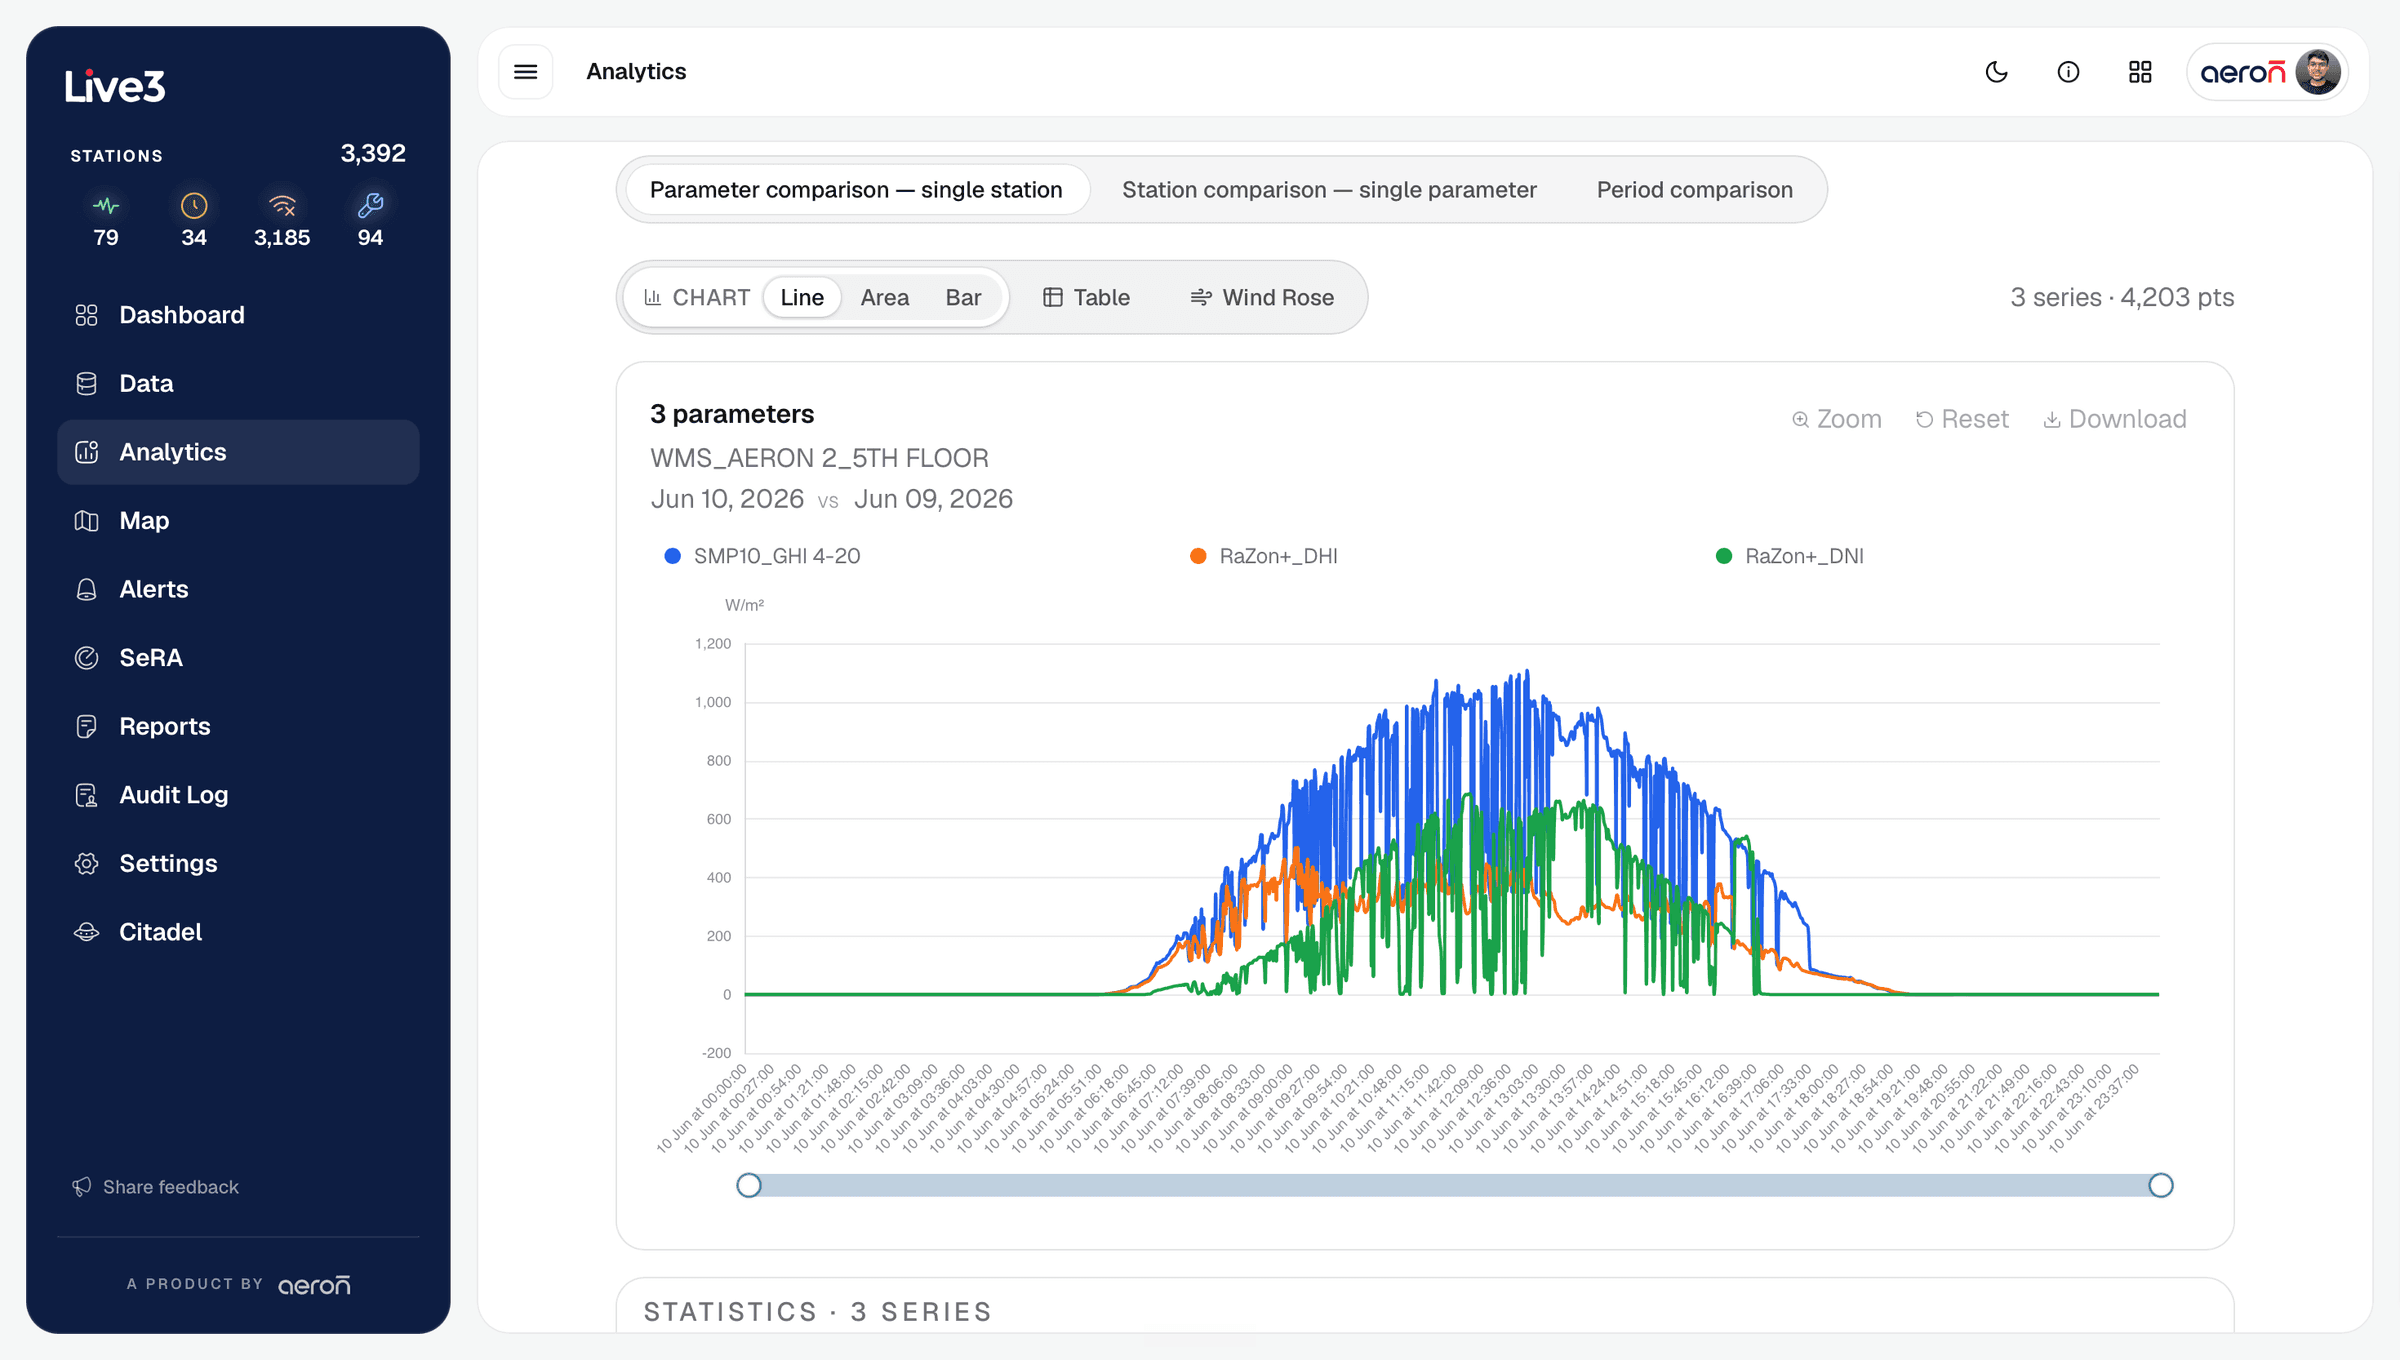
  • Analysis over time, across stations, with a wind rose
  • Single sign-on and role-based access
  • Audit log and data kept in your region

Solar and renewable · Wind · Weather · Mixed-brand fleets

View Product

Where Live3 is used

Solar plants, weather networks, mixed-brand fleets and industrial sites, in one view.

  • Solar and renewable energy

    Performance ratio, CUF and energy across utility-scale and commercial plants, with performance alerts and reports for operators.

  • Weather networks

    Wind rose, rainfall totals and station-by-station comparison for weather agencies, research institutes and agriculture.

  • Mixed-brand fleets

    One view over Aeron loggers, other brands of hardware and CSV uploads, without changing anything in the field.

  • Industrial sites

    Modbus RTU and TCP connections to energy meters, inverters and SCADA, for live plant performance and fault alerts.

Weather data you can rely on

A plant with ten weather stations has ten different readings. Wedant checks every one, names what went wrong, and gives each plant a bankability score out of 100 that you can open all the way down to a single sensor.

Contact

Ask for a demo of Live3 on your own stations, or talk to one of our engineers about your fleet.

Offices

India

Head office and design centre, Pune

Plot No. 7, Lane No. 5, Laxman Nagar, Balewadi
Pune, Maharashtra 411045, India

Open in Google Maps

Factory, Pune

Vivan Kohli Industrial Park, Shed No. 5, Gat No. 446
Old Pune-Mumbai Highway, Naigaon, Kanhe Phata, Talegaon
Pune, Maharashtra 412106, India

Open in Google Maps

Sales and support, Bengaluru

First Floor, Building No. 11, Sai Anugraha
Jeevan Bhima Nagar Main Road
Bengaluru, Karnataka 560075, India

Open in Google Maps

Sales and support, Vijayawada

Door No. 52-1/4-8D, Plot No. 9, 5th Cross Road
Veterinary Colony
Vijayawada, Andhra Pradesh 520008, India

Open in Google Maps

International

Aeron Systems Pvt. Ltd., Sharjah

Saif Executive Office # P8-17-02
Sharjah Airport International Free Zone Authority
PO Box 8000, Sharjah, U.A.E.

Open in Google Maps