
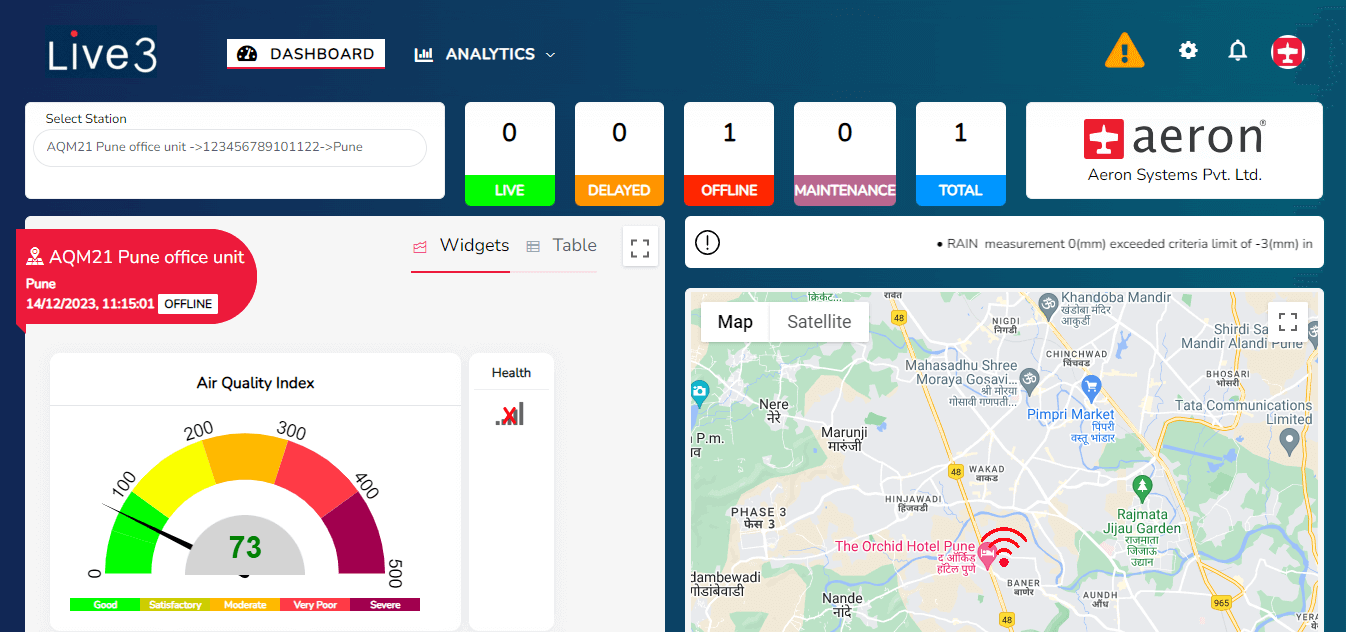
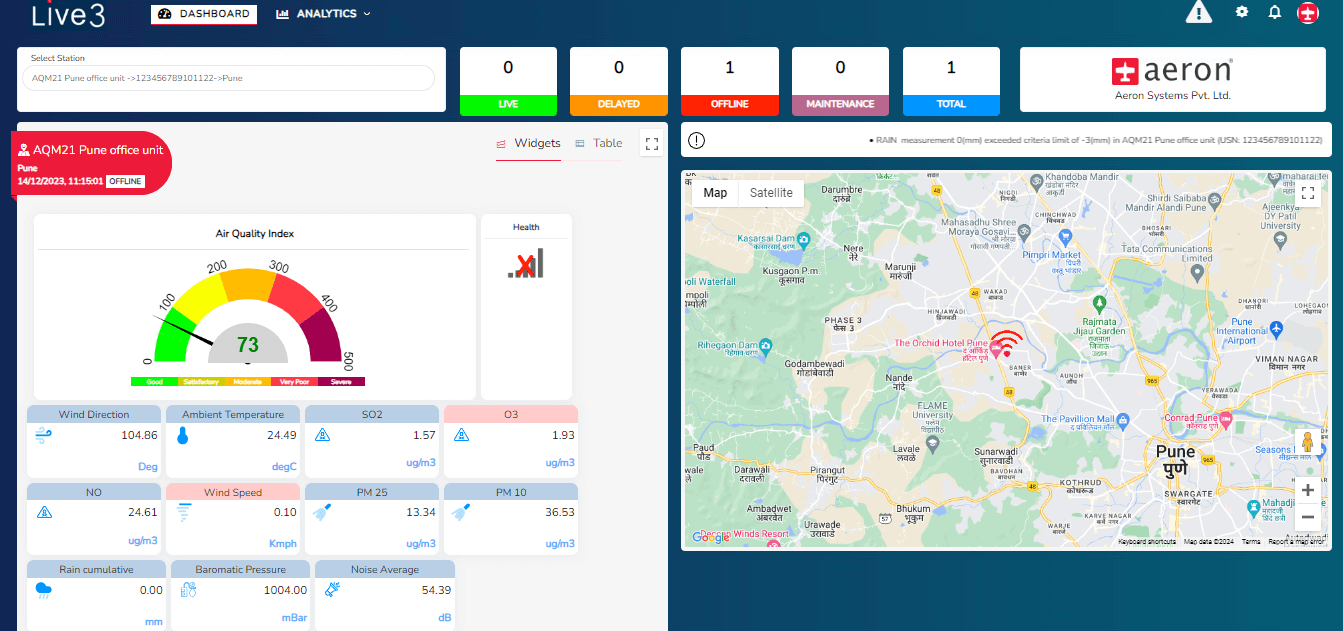
All the Solar Met Stations allocated to the user are listed here.
The status bar indicates the present working state of all the devices like Total no. of devices which are Live, Delayed, Offline, and under Maintenance.
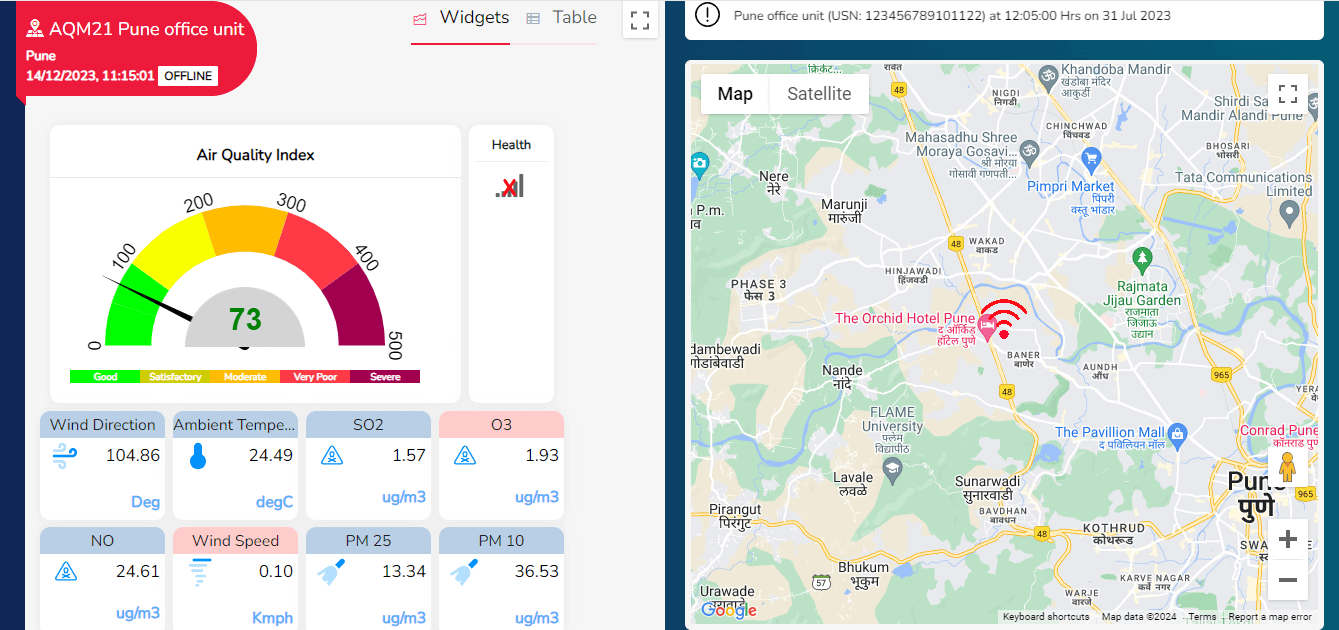
Live view of recent data received from device including the health of the device.
Map view showing geo-location of all the systems installed on filed.
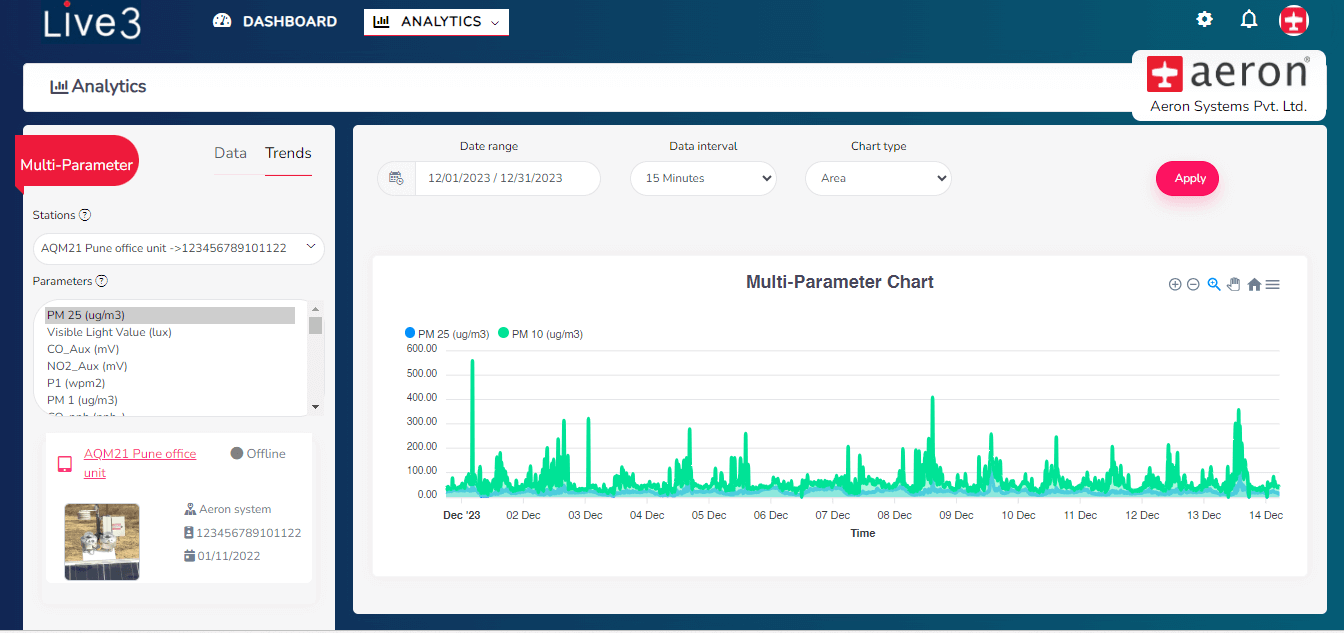
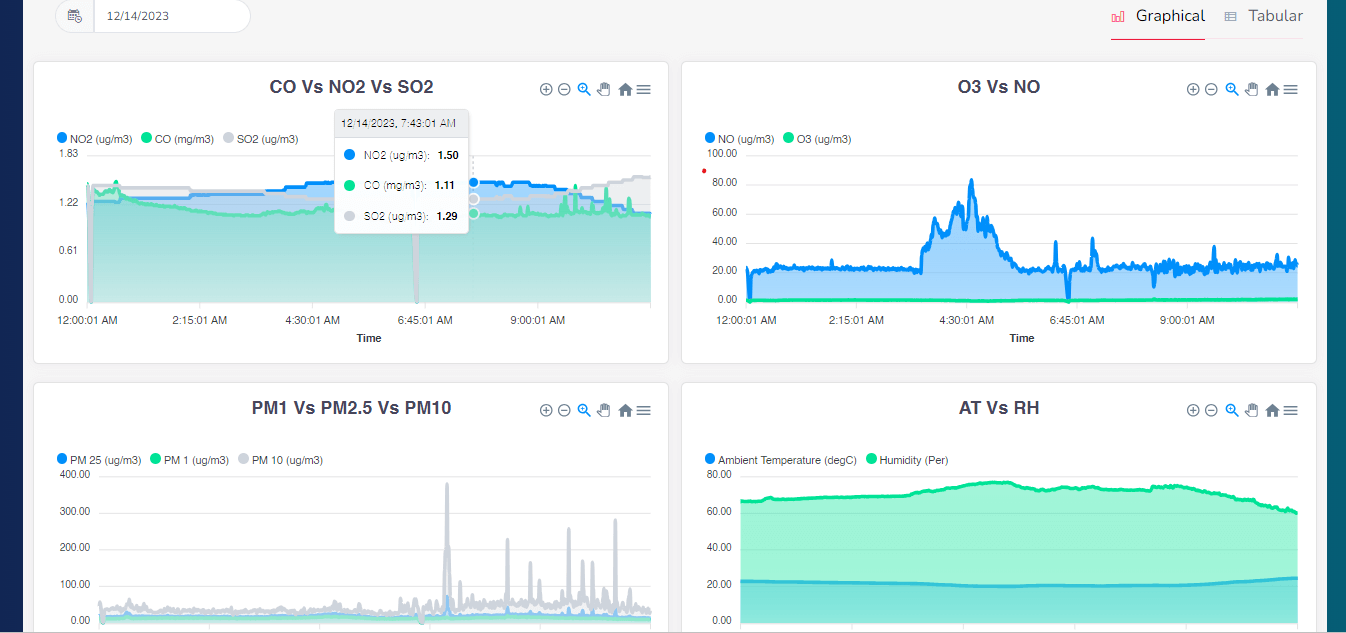
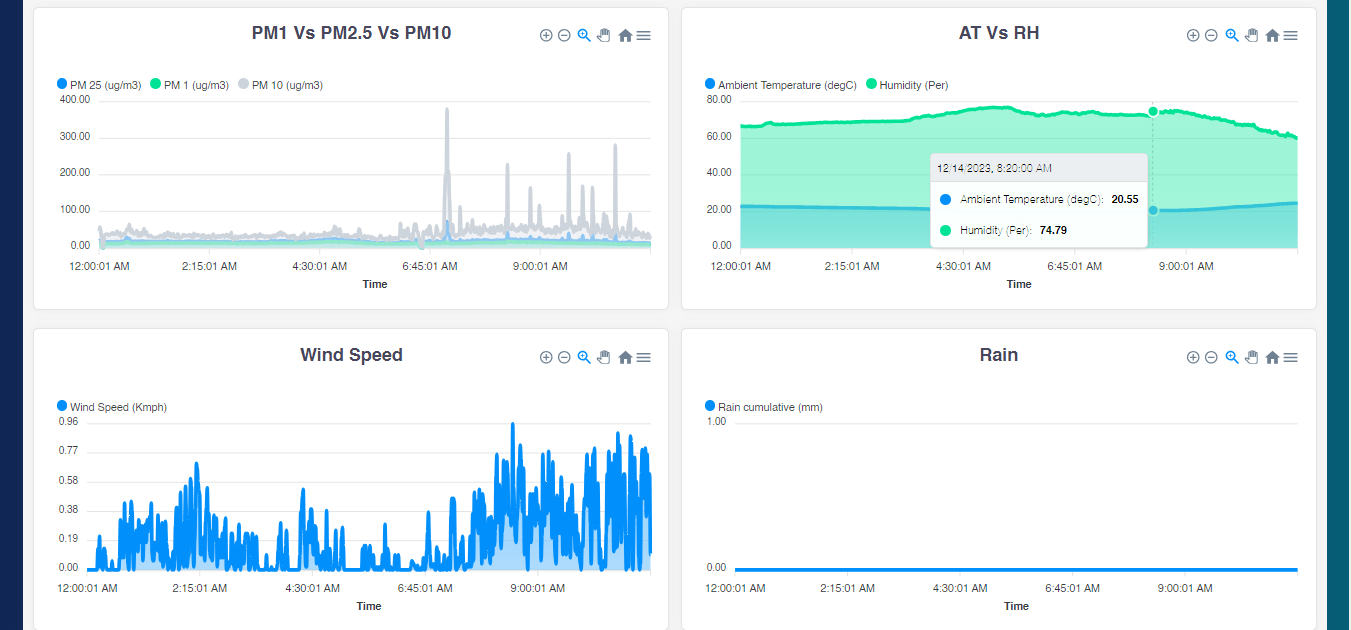
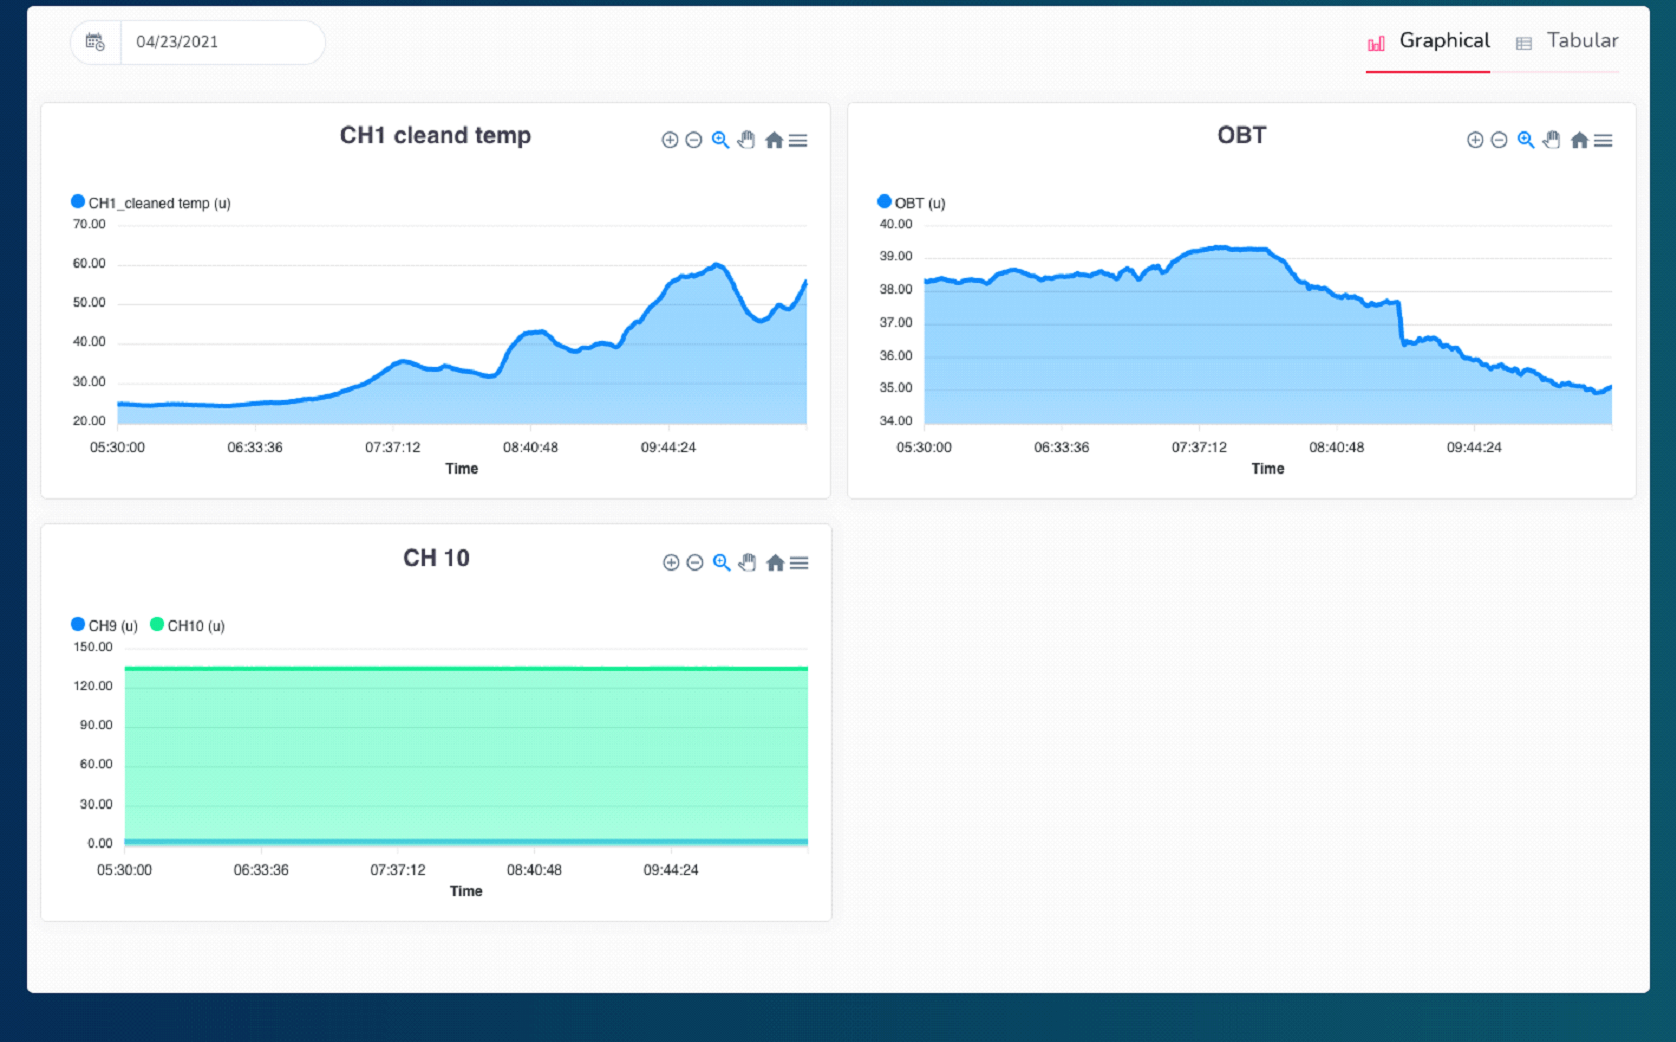
Key parameters trend plotted over user defined time duration.
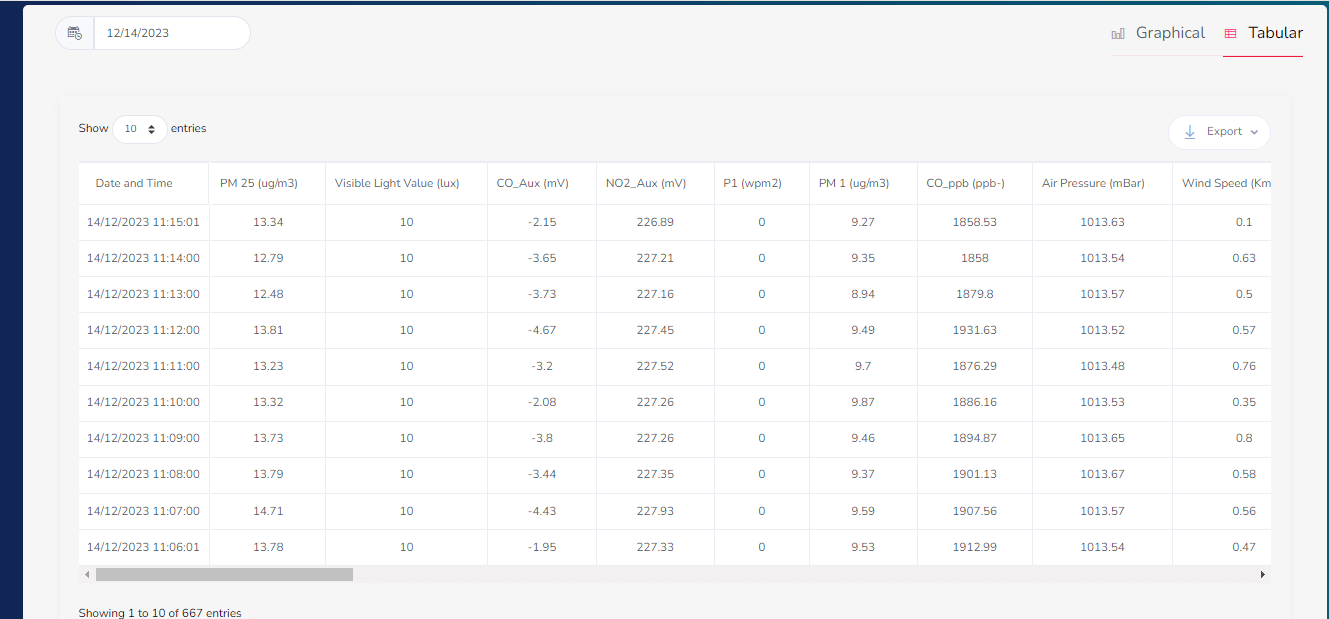
All the data visible in tabular form for user defied interval, can be downloaded in .csv format.
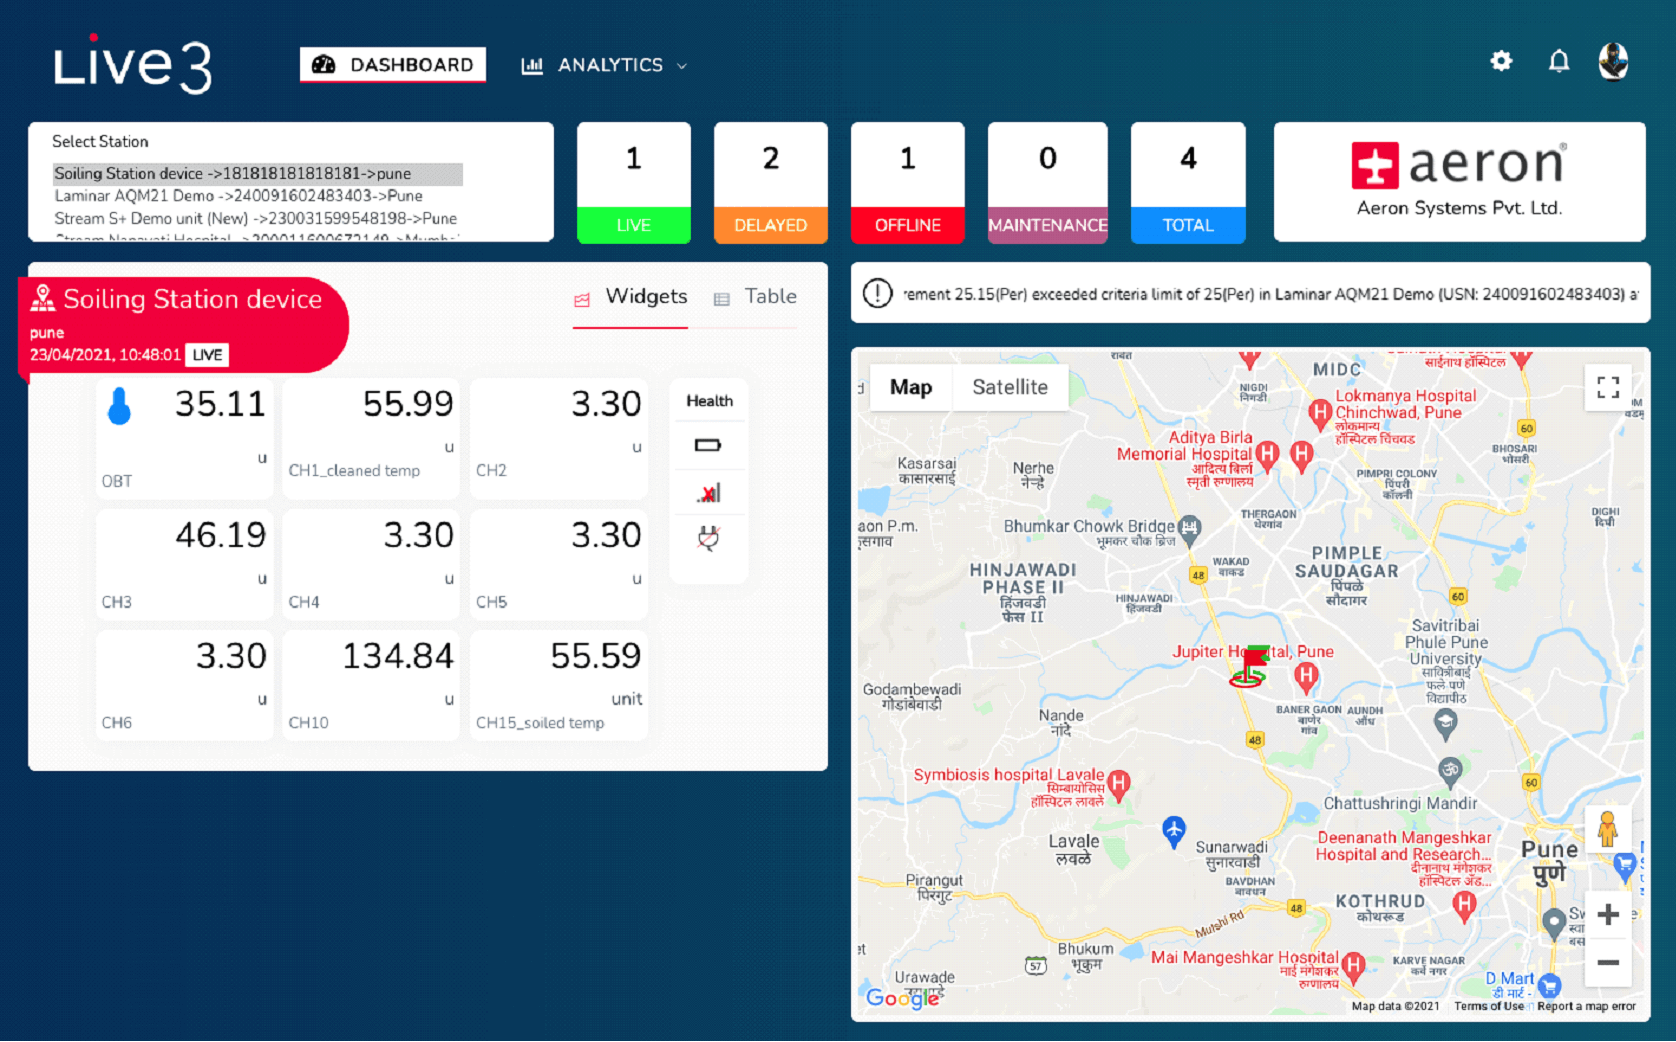
The dashboard page has an interactive layout designed to provide the admin/ user with a quick update of all the stations and precise information allocated to the particular admin / user.


Key parameters trend plotted over user defined time duration.


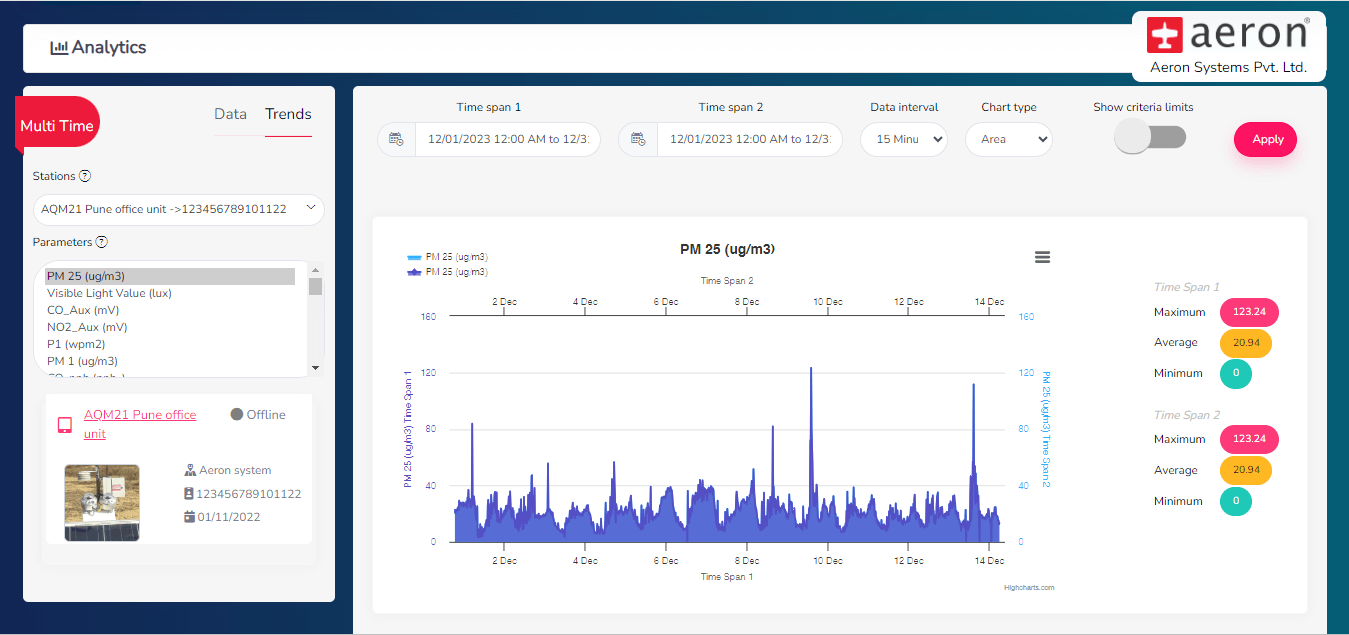
The Live 3 software is loaded with various data analytics features like


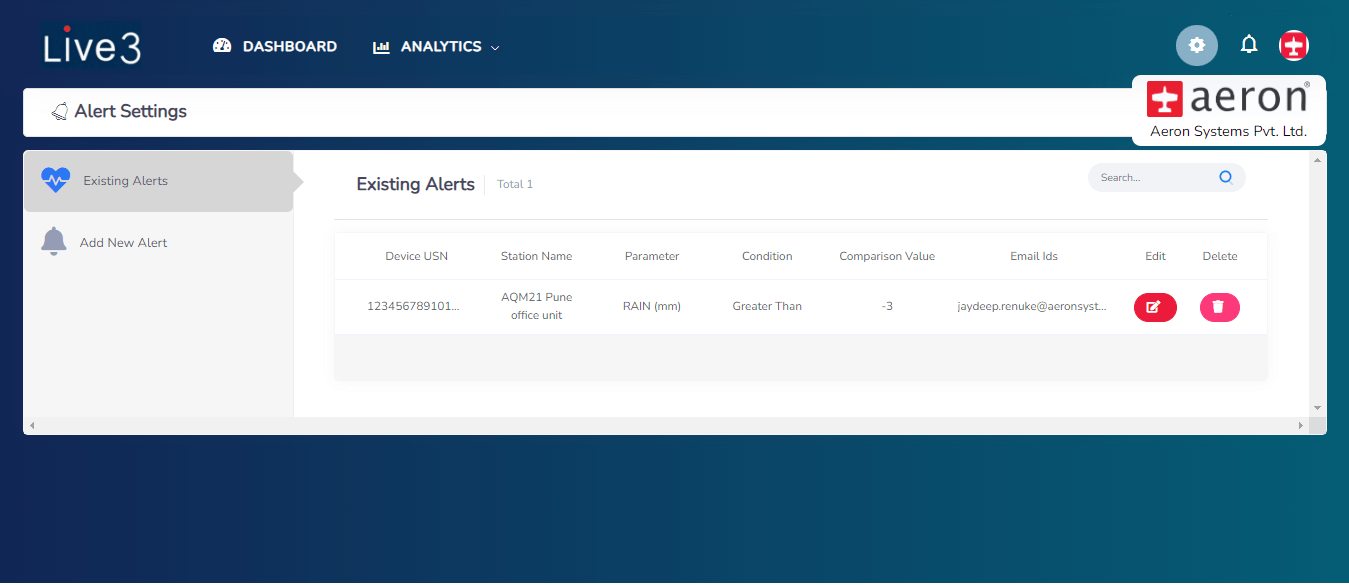
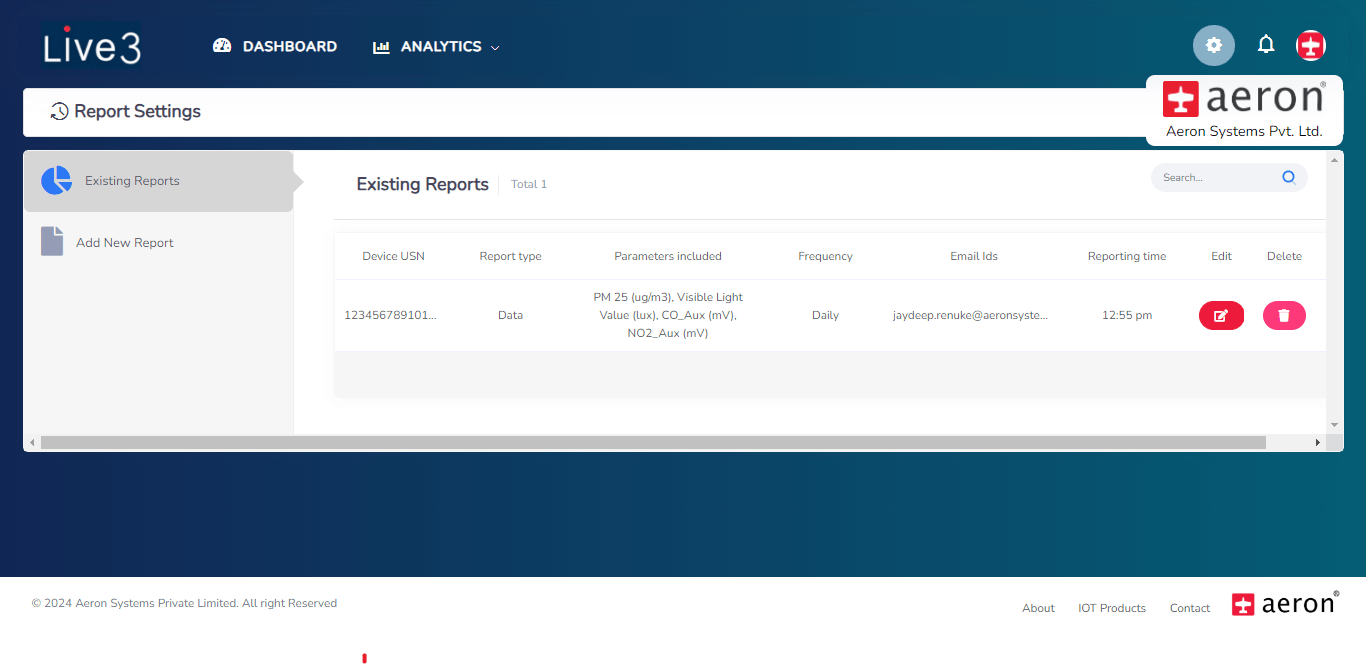
Data reports and health reports are sent to the user inbox at pre-defined time during the day. Get regular email alerts and notifications for threshold breaches, system health problems at user defined


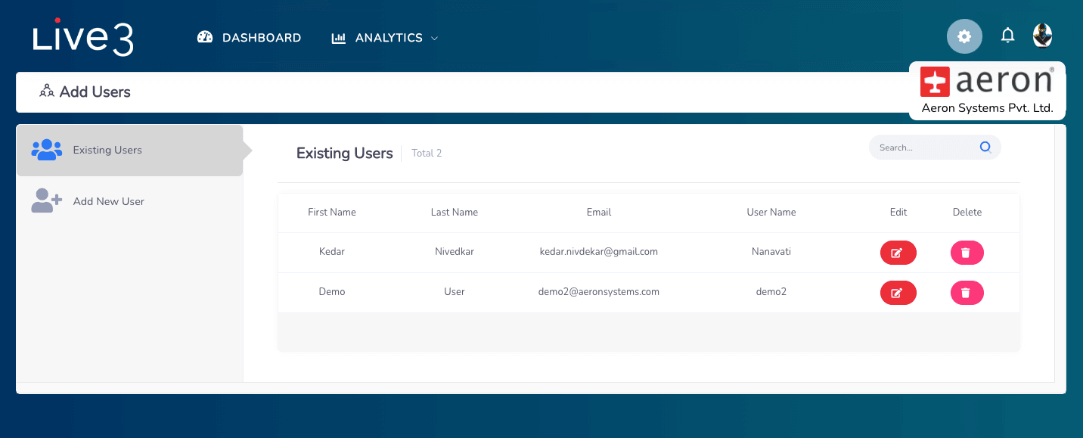
Create and manage multiple users from the single admin account.


